Here are Skyn datasets collected with the 2019 BACtrack Skyn and Skyn app.
The details of each data collection are directly above each graph. Graphs were generated using Transdermal Alcohol Content (TAC) data outputs from the Skyns. All TAC values are in the volumetric units of micrograms of ethanol per litre of air.
For the graphs below, data was collected using the following methods:
- Reference BrAC values were taken at either 15 or 60-minute intervals
- For all BrAC tests, there were at least 15 minutes of no alcohol consumption prior to testing
- The BACtrack Skyn was worn snugly on the underside of the wrist throughout the data collection
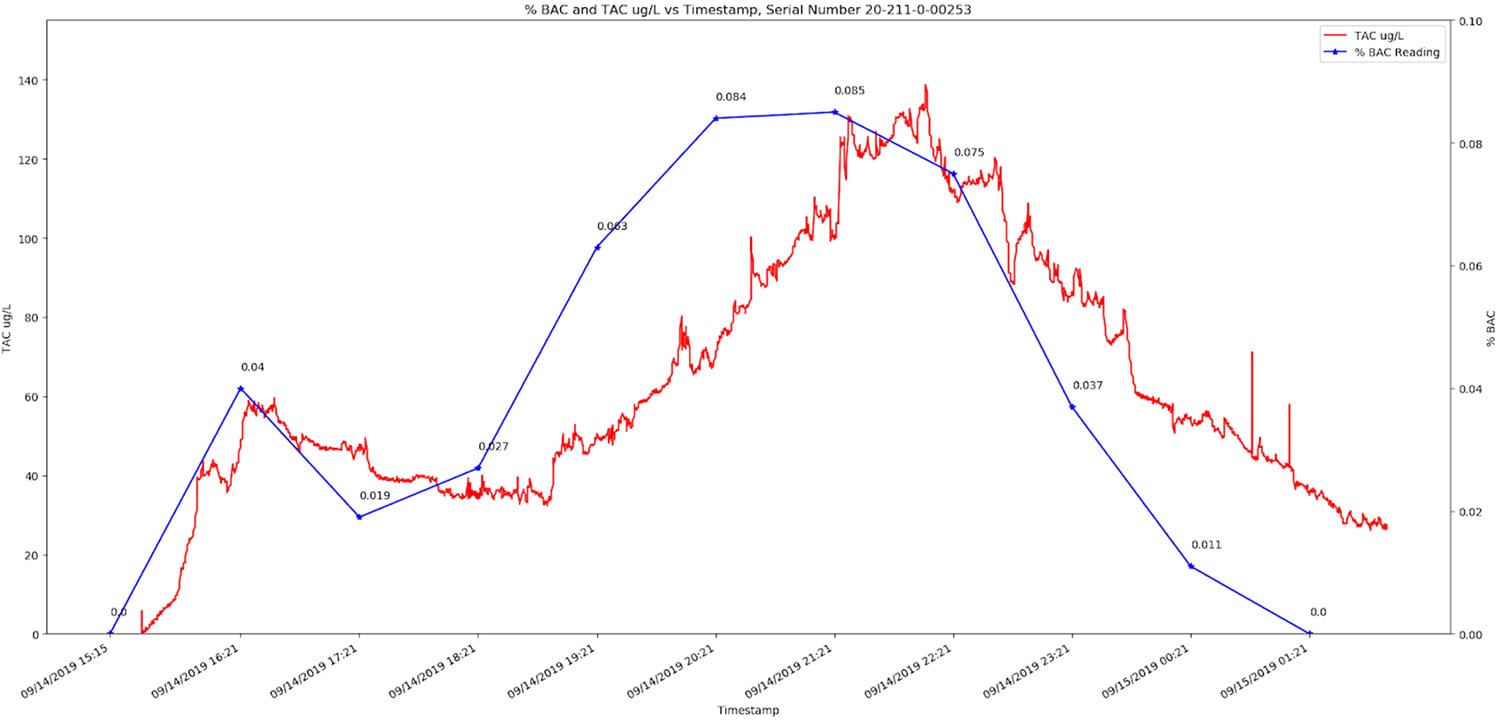
- For the TAC-BAC graphs, % BrAC is on the right y-axis, TAC ug/L on the left y-axis, and timestamp is the x-axis
Dataset #1 – monitored drinking session
- Tester: Female, 29 years old
- 4 standard drinks of 40 proof liquor were consumed within the first hour of data collection
- BrAC Reference values every 15 minutes
Graphed Data:
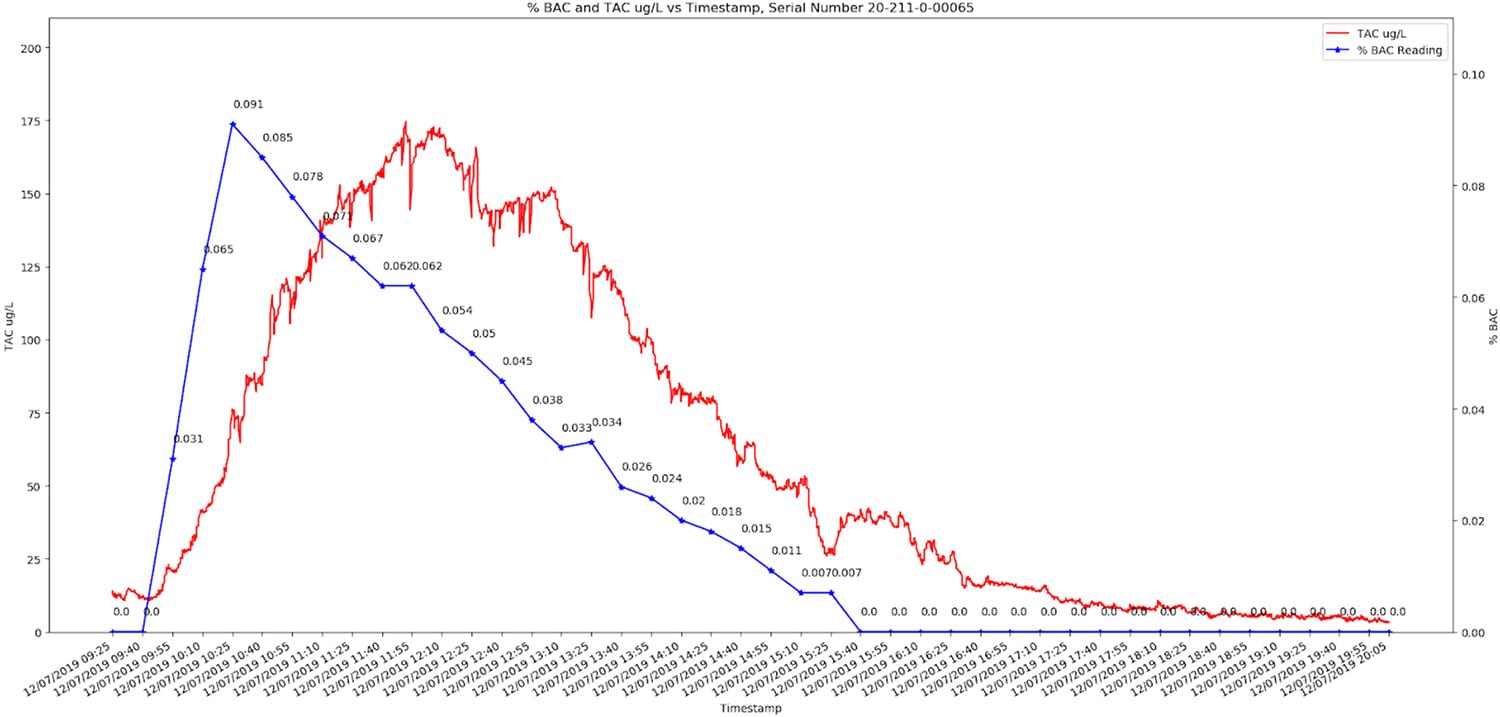
Dataset #2 – monitored drinking session
- Tester: Male, 29 years old
- 6.5 standard drinks of 40 proof liquor were consumed within the first hour of data collection
- BrAC Reference values every 15 minutes
Graphed Data:

Dataset #3 – unmonitored, real-life drinking session
- Tester: Male, 29 years old
- Alcohol was consumed over the course of multiple hours in a single evening
- BrAC Reference values every 60 minutes
Graphed Data:
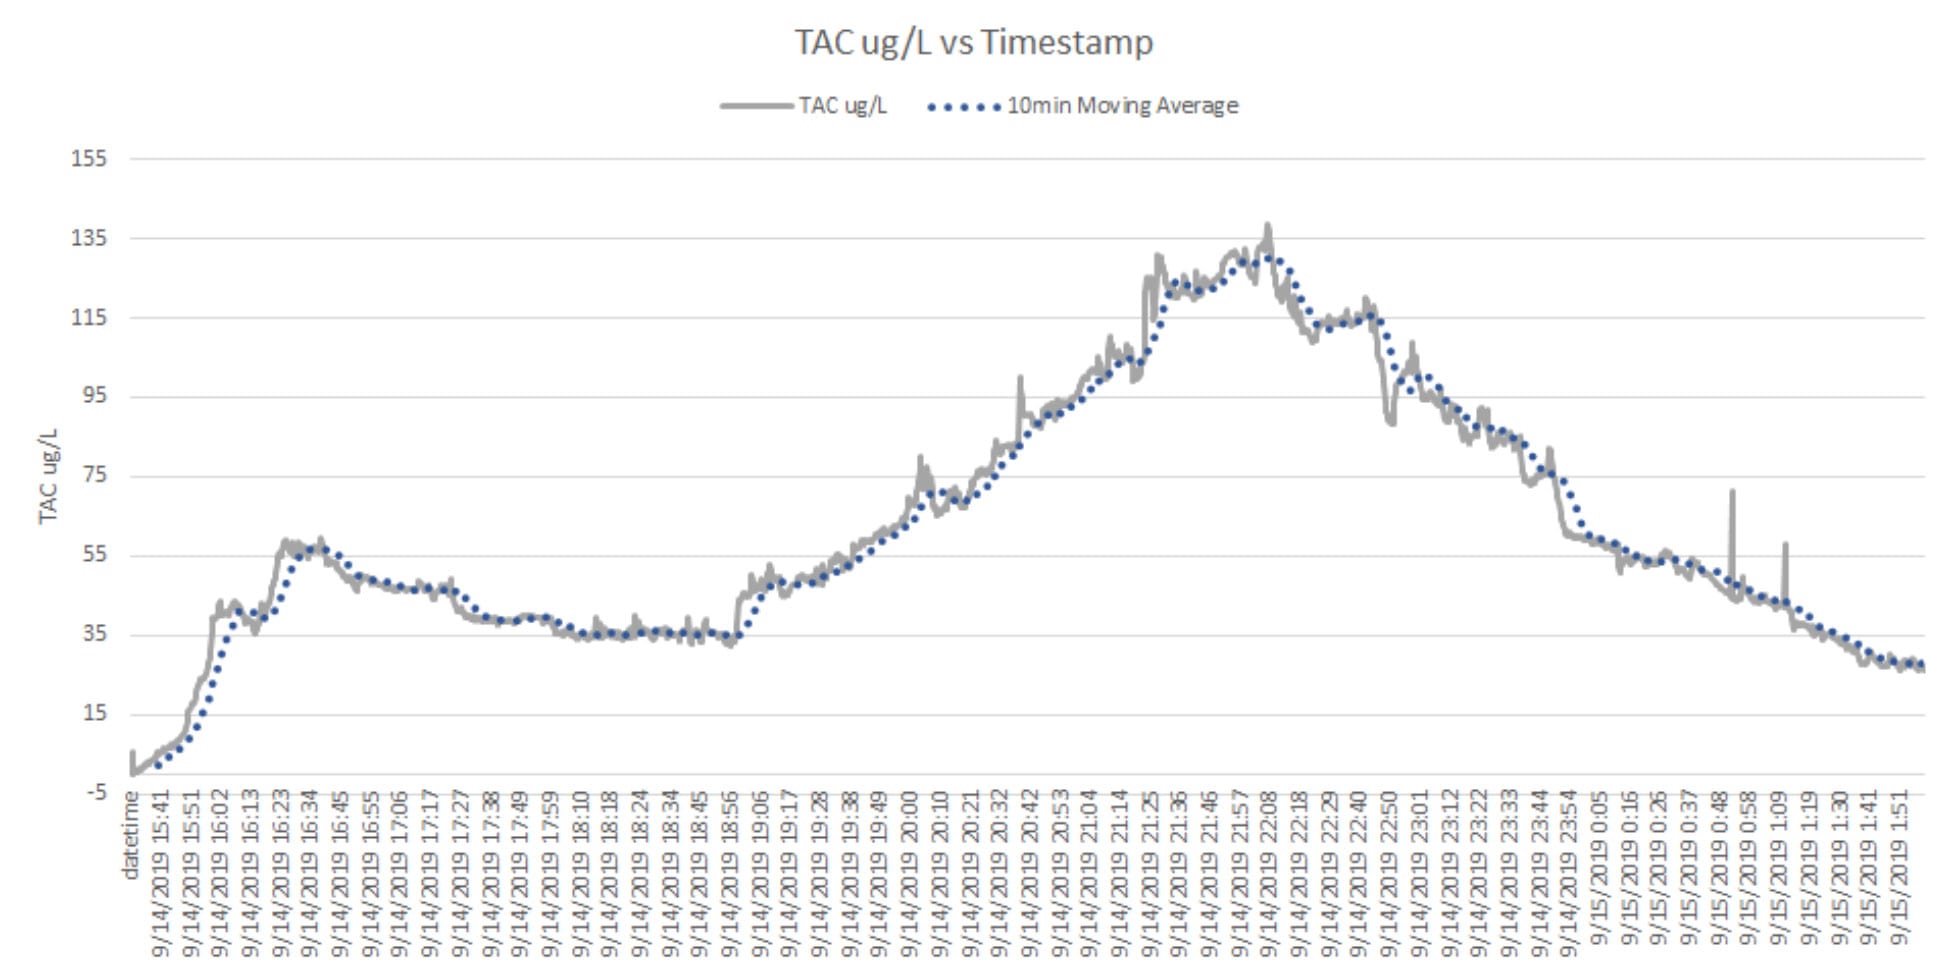
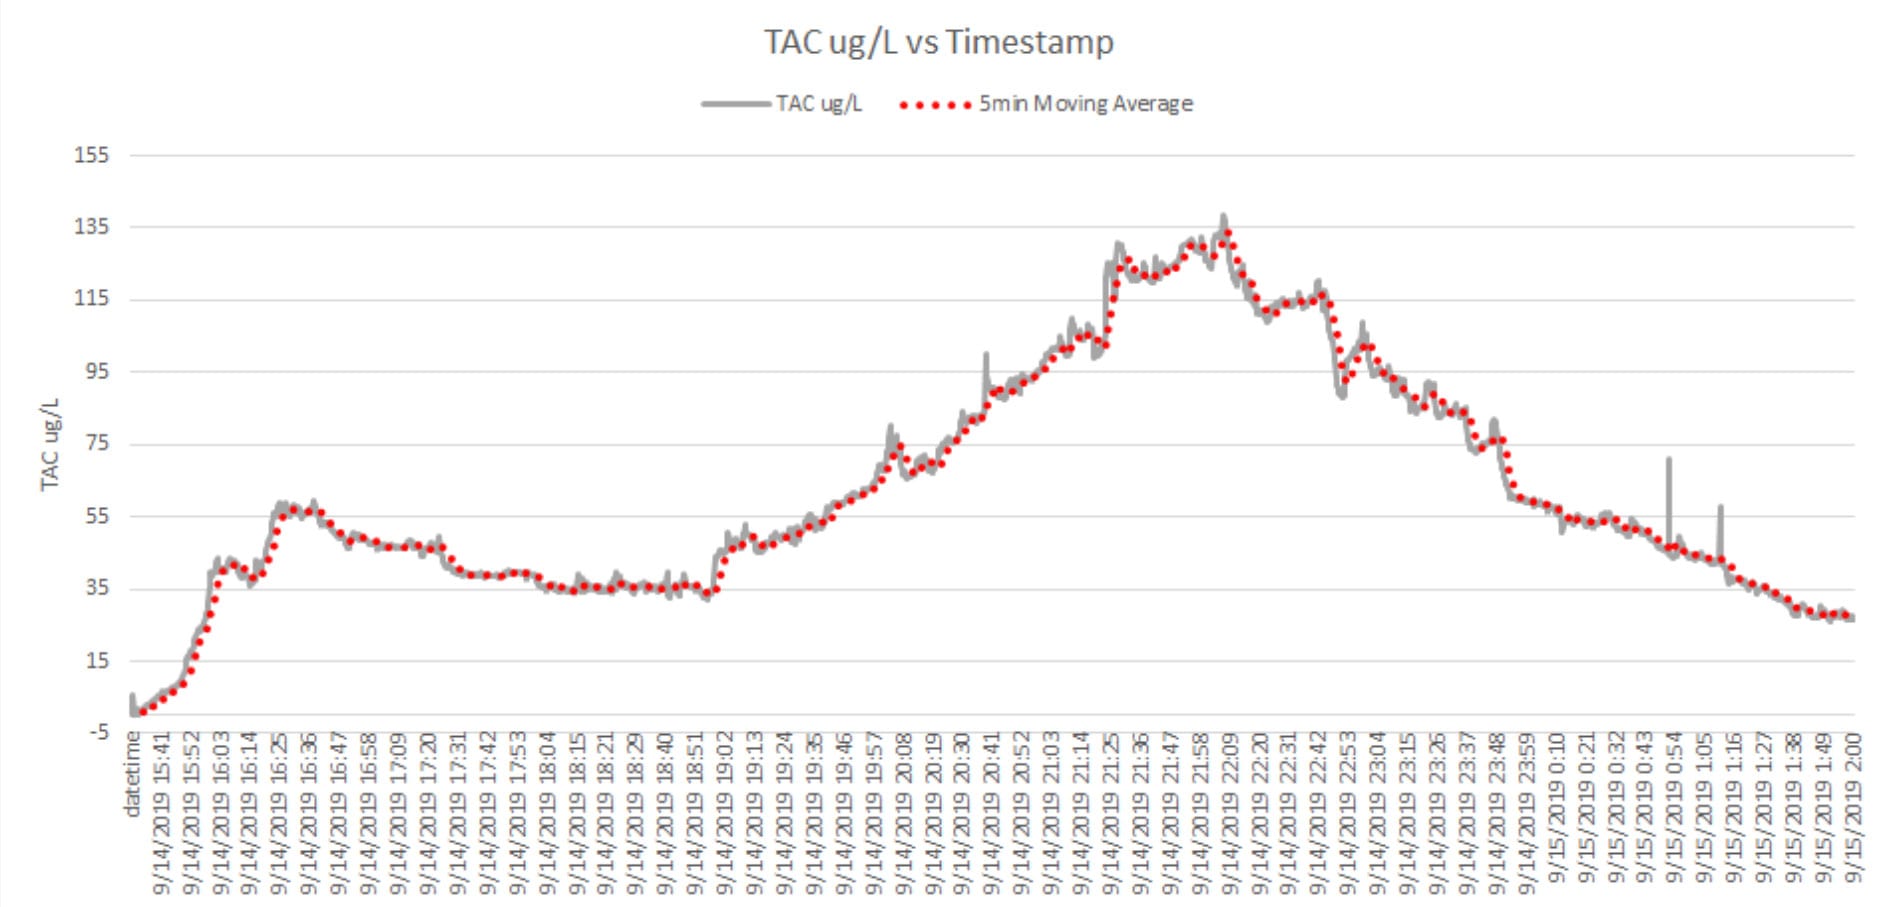
In addition to hardware improvements, there will soon be the option to change the sampling frequency in the app. In the next graphs, you will find the same dataset with a moving average applied to see how the data would look if the sampling frequency was changed.
In these graphs, the y-axis is TAC ug/L and the x-axis is timestamp.
5-minute sample frequency:
10-minute sample frequency: